Five Attribution Models, One Deal, Five Different Answers
By Rajesh Kumar, Founder, Attribi ·
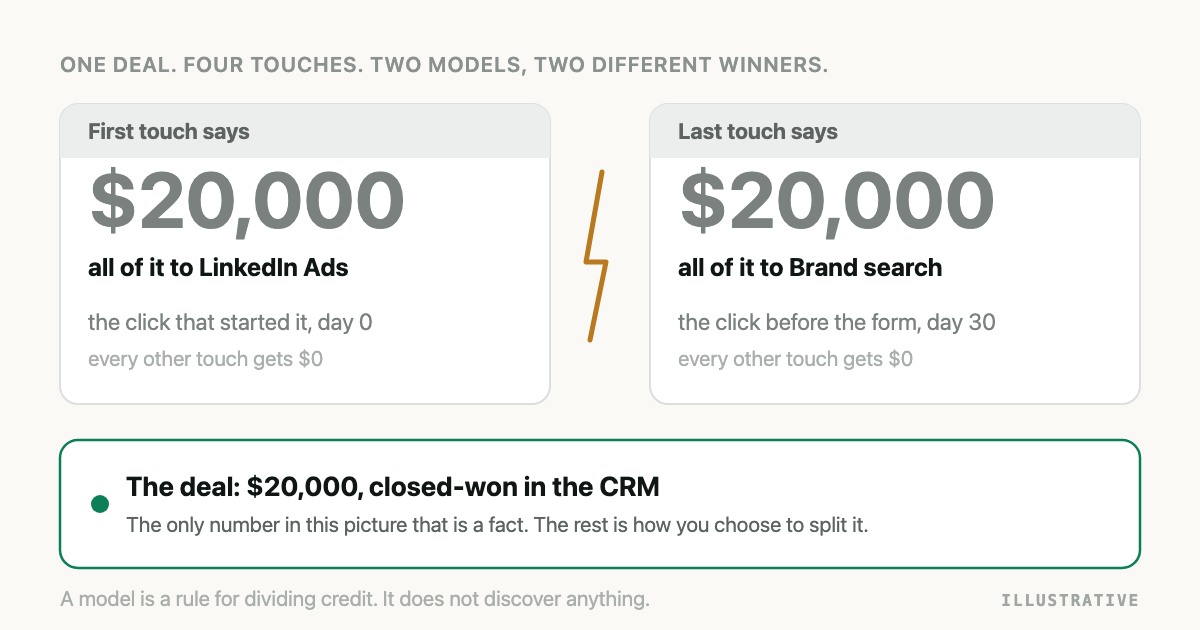
Ask five attribution models which channel produced a deal and you will get five answers. None of them is lying. Each is answering a slightly different question, and most arguments about attribution are really arguments about which question was being asked.
The clearest way I know to explain the models is to stop describing them and run one deal through all of them. So that is what this article does.
What is a multi-touch attribution model?
A multi-touch attribution model is a rule for dividing the credit for one conversion among all the marketing touches that came before it. Single-touch models give everything to one touch, the first or the last. Multi-touch models split the credit across several touches, either evenly, by position in the journey, or by how recently each touch happened.
That is all a model is: a rule for splitting. It does not discover anything. The discovery is in the journey data underneath, which is the list of touches one person had before they converted.
If you want to see your own journeys before reading about how to split them, Attribi records them from the first visit.
The deal
Here is one illustrative B2B deal worth 20,000 dollars. The buyer had four touches over 30 days before filling in the form.
| Day | Touch | Channel |
|---|---|---|
| 0 | Clicked a LinkedIn ad, read a guide | LinkedIn Ads |
| 12 | Searched a generic term, clicked an ad | Google Ads, non-brand |
| 20 | Clicked a retargeting ad | Meta Ads |
| 30 | Searched the company name, clicked, filled in the form | Google Ads, brand |
Thirty days, four touches, three ad platforms. A fairly ordinary path. Now the models.
The five models
First touch
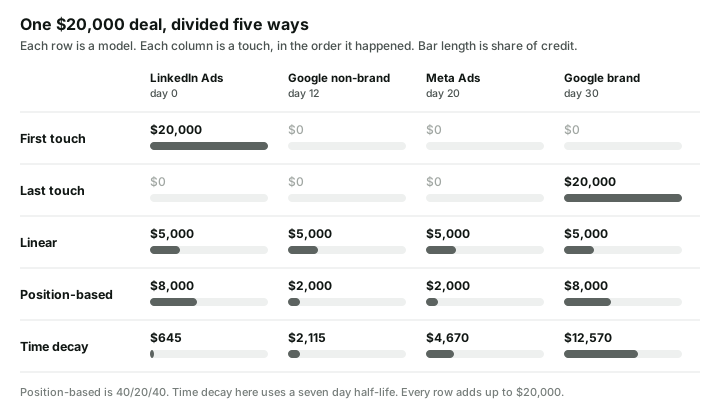
All the credit goes to the first touch. LinkedIn gets 20,000. Everything else gets nothing.
It answers: what introduces us to buyers? It is the right lens for judging awareness spend, and it is blind to everything that happened in the 30 days afterwards.
Last touch
All the credit goes to the final touch before the conversion. Branded search gets 20,000.
It answers: what was the last thing someone did before converting? It is simple, it is what most ad platforms report by default in one form or another, and it has a well-known flaw. People who already decided to buy search for your name. Last touch hands that click the whole deal, so brand campaigns look brilliant and the channels that created the demand look useless.
Linear
Every touch gets an equal share. Four touches, 5,000 each.
It answers: who was involved at all? Linear is fair in the way splitting a restaurant bill evenly is fair. Nobody is ignored, and nobody believes the retargeting click mattered exactly as much as the ad that started the whole thing.
Position-based
Also called U-shaped. The first touch gets 40 percent, the last touch gets 40 percent, and the remaining 20 percent is shared among everything in between. Here: LinkedIn 8,000, branded search 8,000, and 2,000 each for the two middle touches.
It answers: what opened the deal and what closed it, with a nod to the middle? For lead gen with a few touches, this is the model I find most useful day to day, because the two questions a marketer most often has to answer are where buyers come from and what gets them over the line.
Two details that guides usually skip. With a single touch, that touch gets everything, in every model. With exactly two touches there is no middle, so position-based becomes a 50/50 split.
Time decay
Touches closer to the conversion get more credit, and the weight halves over a fixed period. With a seven day half-life, a touch seven days before the conversion counts half as much as one on the day itself, and a touch 14 days before counts a quarter.
For this deal that gives roughly: LinkedIn 645, non-brand search 2,115, Meta 4,670, branded search 12,570.
It answers: what was happening as the decision got close? It suits short cycles and promotions. On a long cycle it quietly punishes whatever started the journey. Look at LinkedIn: 3 percent of the deal it opened.
The whole picture in one table
| Channel | First touch | Last touch | Linear | Position-based | Time decay |
|---|---|---|---|---|---|
| LinkedIn Ads | $20,000 | $0 | $5,000 | $8,000 | $645 |
| Google Ads, non-brand | $0 | $0 | $5,000 | $2,000 | $2,115 |
| Meta Ads | $0 | $0 | $5,000 | $2,000 | $4,670 |
| Google Ads, brand | $0 | $20,000 | $5,000 | $8,000 | $12,570 |
Read the LinkedIn row from left to right. Depending on the model, the same ad on the same deal is worth 20,000 dollars, nothing, or something in between. If you have ever sat in a budget meeting where two people held two reports and could not agree, this row is why.
So which model is right?
None. That is the honest answer and also the useful one.
A model is a lens. The mistake is choosing one and treating its output as fact. The better habit is to read the same deals through two or three models and pay attention to where they disagree, because the disagreement tells you what kind of work a channel does.
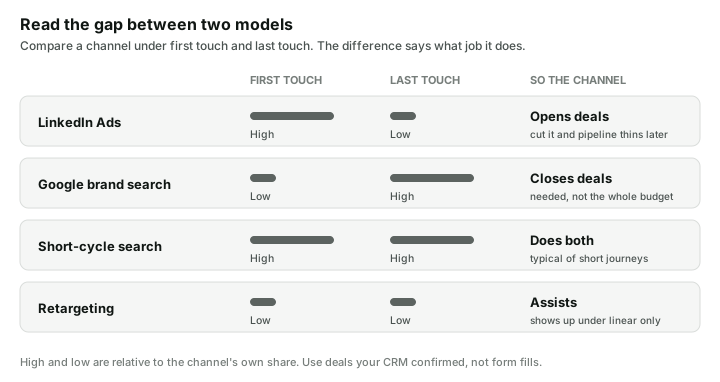
- High on first touch, low on last touch: the channel opens deals. Cut it and the pipeline dries up a quarter later, when nobody remembers why.
- Low on first touch, high on last touch: the channel closes deals that something else started. It needs to exist. It does not deserve the whole budget.
- About the same on both: the channel does both jobs, usually on short journeys.
- Shows up only under linear: the channel assists. Worth keeping if it is cheap.
In the example, LinkedIn is plainly an opener and branded search is plainly a closer. A last touch report would tell you to move the LinkedIn budget into brand search. Do that, and in two months there will be fewer people searching for the brand.
What about data-driven attribution?
Data-driven models do not use a fixed rule. They look at many journeys, converting and not, and estimate how much each kind of touch changes the odds of a conversion.
This is now the default inside Google Ads. Google removed first click, linear, time decay and position-based models in 2023, which leaves data-driven and last click. Google Analytics 4 dropped the same rule-based models.
Two cautions. A data-driven model needs a lot of conversions before its estimates mean anything, and lead gen accounts are often short of them. And a platform's data-driven model sees only that platform's own touches. Google's version knows nothing about the LinkedIn ad on day 0. It is dividing credit among Google touches, very cleverly, for a deal LinkedIn opened.
That is the real limit of any model run inside an ad platform. It can only split what it can see.
The part no model fixes
Every number above started from one assumption: the deal was worth 20,000 dollars and it really closed.
If the conversion you are attributing is a form fill, a model is dividing credit for something that may never become revenue. Run five careful models over 400 form fills of which 22 were real buyers, and you get five careful descriptions of who is good at producing form fills.
So the order of work is: first make sure the thing being attributed is an outcome your CRM confirmed, with a real value. Then choose how to split it. The first step changes your decisions far more than the second. Why form fill counts mislead covers that side, and how each platform counts conversions covers why their totals never agree.
How Attribi handles models
I build Attribi, so here is exactly what it does, including one thing I would rather say plainly than have you find out.
Attribi records each visitor's touches across channels, ties them to the lead, and then to the deal value when your CRM marks it won. The Attribution page shows the same revenue under five models side by side: first touch, last touch, linear, position-based at 40/20/40, and a fifth labelled data-driven.
The plain part: that fifth model is currently a time decay calculation with a seven day half-life, the same one used in the example above. It is not a machine-learned model trained on your converting and non-converting journeys. It is useful, and it is the most recency-weighted view Attribi offers, but you should read it as time decay.
Which models you get depends on the plan. Free shows first and last touch. Growth adds linear and position-based. The fifth model is on Scale and above. Every new workspace starts with 30 days on the Pro plan, so you can read your own deals through all five before deciding whether the differences matter to you.
Frequently asked questions
What is the difference between single-touch and multi-touch attribution? Single-touch attribution gives all the credit for a conversion to one touch, either the first or the last. Multi-touch attribution divides the credit among several touches in the journey, using a rule such as equal shares, position, or recency.
Which attribution model is best for B2B lead generation? There is no single best model. Position-based is a practical default for lead generation because it credits both the touch that introduced the buyer and the touch that converted them. Reading the same deals under first touch and last touch as well shows which channels open deals and which close them.
What is position-based attribution? Position-based attribution, also called U-shaped, gives 40 percent of the credit to the first touch, 40 percent to the last touch, and shares the remaining 20 percent among the touches in between. With only two touches the credit is split evenly.
What is time decay attribution? Time decay attribution gives more credit to touches that happened closer to the conversion. The weight of a touch halves over a set period, such as seven days, so recent touches count for much more than early ones.
Does Google Ads still offer linear and position-based attribution models? No. Google removed the first click, linear, time decay and position-based models from Google Ads in 2023. The remaining options are data-driven attribution, which is the default, and last click.
Why do different attribution models give different results for the same campaign? Because each model uses a different rule to divide the same conversion. A campaign that usually starts journeys scores well under first touch and badly under last touch, while a campaign that usually ends them shows the opposite.
The takeaway
An attribution model is a way of splitting a number, so the number has to be real first. Once it is, do not pick a winner among the models. Put two of them next to each other and read the gap. A channel that looks expensive under last touch and valuable under first touch is not confusing. It is telling you what it does. You can see that gap on your own deals by trying Attribi free for 30 days.